章節 28 Analyzing PPI Effect
U.S Core PPI: The U.S PPI MoM Came Unexpected with 0.1% More than Expected at 0.3%
Summary:
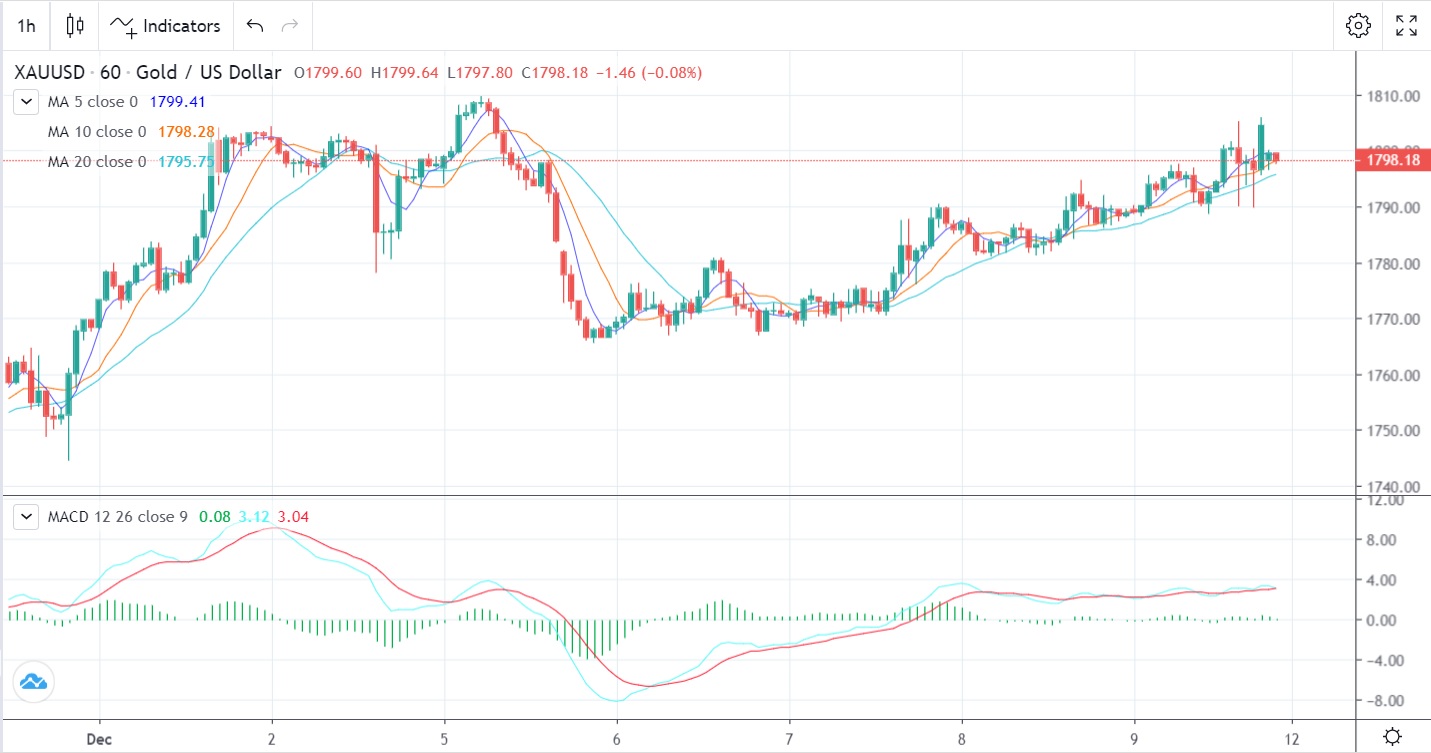
The U.S. economy showed some recovery versus major currencies after releasing the PPI data on 09-12-2022 at 5:30 PM (GMT +4) with an unexpected result of 0.3%. Gold went down by $15 breaking the support level at $1795
Recommended Entry Price:
Gold:
Entry Price: 1790.00
Target Price: 1850.00
SL Price: 1760.00
1. Fundamentals
The U.S released the PPI report for November on December 9, 2022. The PPI is one of the major monthly indicators that affect the market widely, it measures the change in the price of goods sold by manufacturers. It is a leading indicator of consumer price inflation which accounts for the majority of overall inflation. A higher-than-expected data is bullish for the dollar, and lower-than-expected data is bearish for the dollar. The data came out to be 0.3% rather than the forecasted result of 0.2% which was bearish for the dollar. Bulls interfered and the dollar index showed some recovery from 104.50 reaching 115.30 before bouncing back down.
Gold has fallen sharply from $ 1806 to $1788 level breaking the support level, but it is expected to recover in the upcoming days affected by world inflation, the interest rate in Europe, U.S – China tensions, and the overall world political situation. In addition to the PPI, almost all U.S fundamentals came out to be green!
Major traders are holding their positions on Gold for further increases in prices.
2. Technical Analysis
Gold Daily Chart
The daily gold pattern shows a bullish engulfing with possible prices touching the $1810 level.
Support and resistance:
1797.73
1795.64
1794.41
Pivot: 1798.96
1804.37
1802.28
1801.05
3. Trading Recommendations
High Probability Scenario:
Long Above: 1798
Resistance TP1: 1802
Resistance TP2: 1805
Alternative Scenario:
Short Below: 1792
Support TP1: 1789
Support TP2: 1785


