
บทที่ 36 Gold Price Increase Explanation
Gold: Gold Prices Touched 1833 Amid Threatens of a China-Taiwan War
Summary:
Gold prices increased sharply in a time frame 5 minutes later on December 27, 2022. The issue was analyzed by the possibility of China invading Taiwan. Gold prices increased from 6:00 P.M (GMT + 4) to 8 P.M (GMT + 4) from $1802.00 to $1833.00 showing the sharpest increase since Russia invaded Ukraine.
1. Fundamentals
The U.S Dallas Fed Business Activity Index report was released on December 27, 2022. This indicator is one of the major monthly indicators that affect the market widely, it is used to calculate the index for each indicator. When the share of firms reporting an increase exceeds the share of firms reporting a decrease, the index will be greater than zero, suggesting the indicator has increase over the prior month. If the share of firms reporting a decrease exceeds the share reporting an increase, the index will be below zero, suggesting the indicator has decrease over the prior month. An index will be zero when the number of firms reporting an increase is equal to the number of firms reporting a decrease. A higher-than-expected data is bullish for the dollar, and lower-than-expected data is bearish for the dollar. The data came out to be -18.8 which is less than expected, and the dollar index dropped accordingly.
Gold is expected to rise to the 1850 level breaking the resistance level, and is expected to increase further in the upcoming days affected by the 2023 interest rate projections, the interest rate in Europe, U.S – China tensions, and the overall world political situation.
Major traders are holding their Gold positions for further price increases.
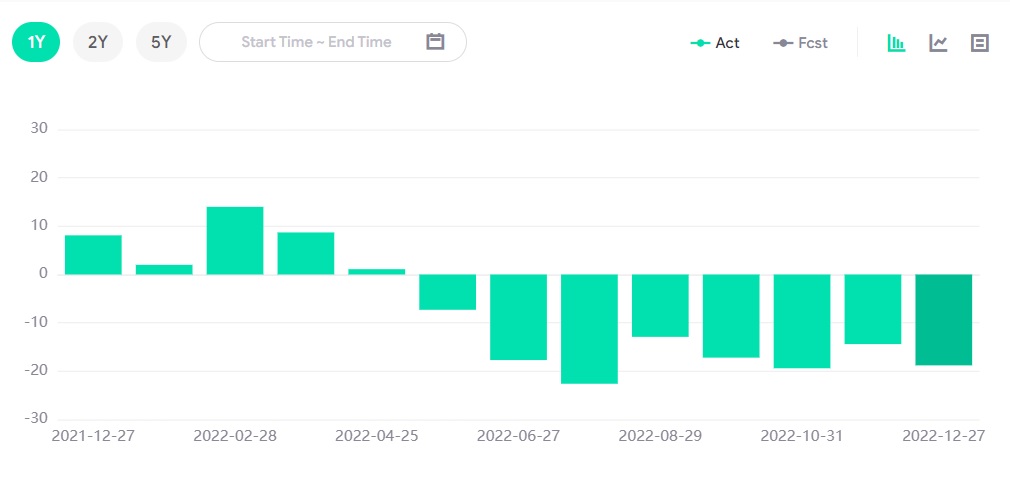
U.S Dallas Fed Business Activity Index
2. Technical Analysis
Gold Daily Chart
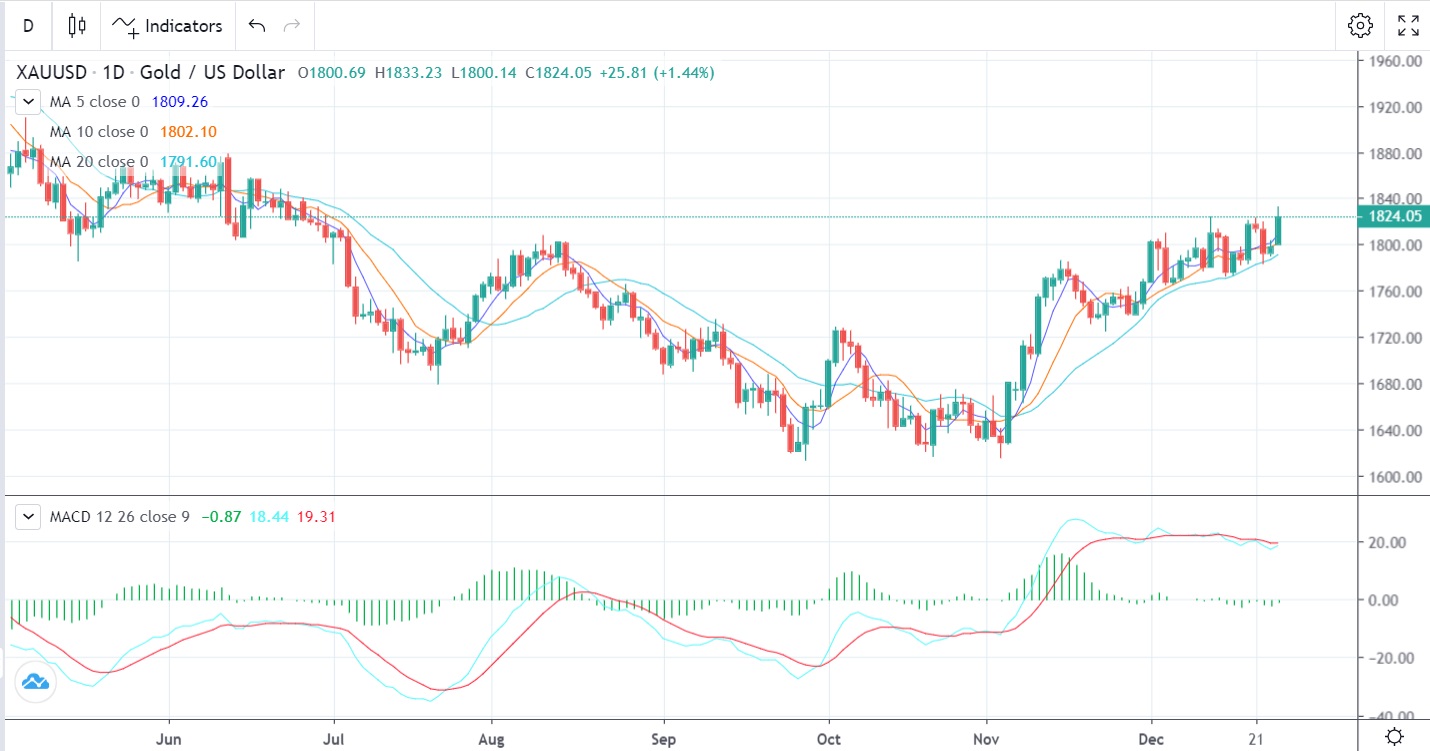
The daily gold pattern shows a bullish engulfing with possible prices touching the $1850 level later in 2023.
Support and resistance:
1861.00
1842.84
1836.00
Pivot: 1822.04
1779.47
1761.02
1738.57
3. Trading Recommendations
Trading Direction: Long
Entry Price: 1815.00
Target Price: 1850.00
Stop Loss: 1795.00


