
บทที่ 16 Initial Jobless Claims Effect 10-11-2022
U.S Initial Jobless Claims: The U.S Initial Jobless Claims is expected to Come at 220K & 3K more than the Previous Result at 217K
Summary:
The U.S economy will show strong volatility after releasing the U.S Weekly Jobless Claims data on 10-11-2022 at 5:30 PM (GMT +4) with an expected result of 220K. If similar to expected, we might see a huge increase in gold prices and a major drop in DXY.
1. Fundamentals
The U.S Weekly Initial Jobless Claims report will be released on November 10, 2022. The Jobless Claims is one of the major monthly indicators that affect the market widely, it measures the number of individuals who filed for unemployment insurance for the first time during the past week. A higher-than-expected data is bearish for the dollar, and lower-than-expected data is bullish for the dollar. The data is expected to come out at 220K, an increase of 3K from the previous result, which was bullish for the dollar. If everything went as expected bears will interfere and a major drop in DXY will be noted.
Gold is expected to rise to the 1725-1730 level breaking the resistance level, but it is expected to recover in the upcoming days affected by the interest rate decision for December by the FOMC, the interest rate in Europe, U.S – China tensions, and the overall world political situation. In addition to the Jobless Claims, eyes and ears on the US midterm elections, as well as the U.S CPI Data that measures the inflation level.
Major traders are holding their Gold positions for further price increases.
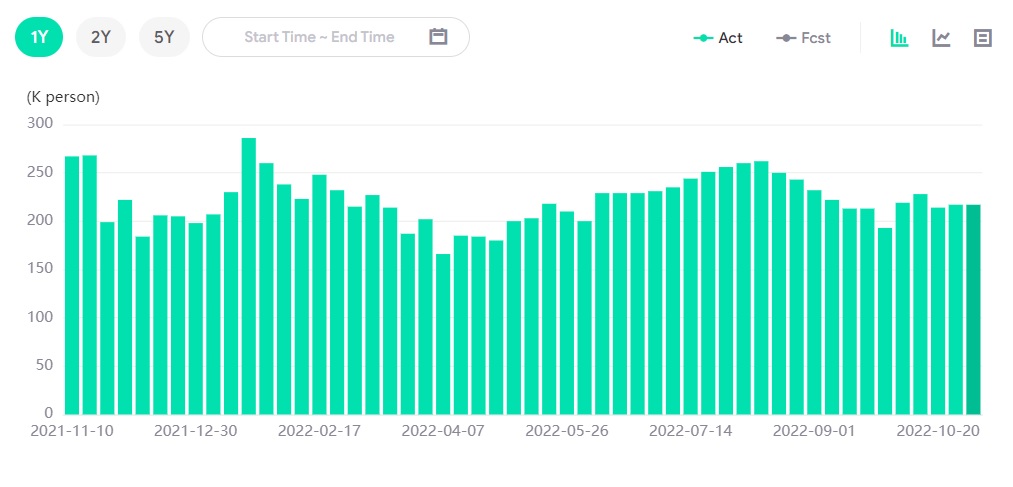
U.S Initial Jobless Claims Chart
2. Technical Analysis
Gold Daily Chart
The daily gold pattern shows a bullish engulfing with possible prices touching the 1725 level before bouncing down again.
Support and resistance:
1705.24
1702.42
1701.15
Pivot: 1706.51
1714.42
1711.60
1709.51
3. Trading Recommendations
High Probability Scenario:
Long Above: 1711.00
Resistance TP1: 1715.00
Resistance TP2: 1719.00
Alternative Scenario:
Short Below: 1705.00
Support TP1: 1701.00
Support TP2: 1697.00


