
Chapter 4 Market Technical 24th April 2023
Technical Analysis 24th April 2023
Gold (XAUUSD)
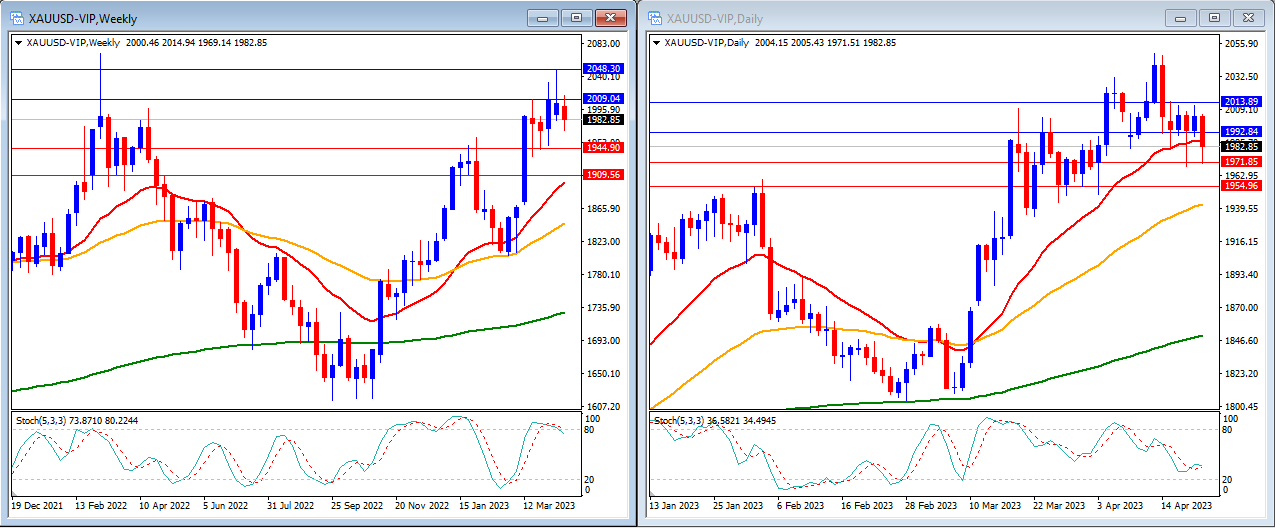
Last week, gold moved lower than the $2,000 level below our support levels. Gold closed the week at $1,982.
On the weekly timeframe, we can see that the Stochastic Indicator is exiting the overbought level. The gold price is currently moving above the 20, 50, and 200-period moving averages.
Our weekly resistance levels are at $2,009 and $2,048 with the support levels at $1,944 and $1,909.
Meanwhile, on the daily timeframe, the Stochastic Indicator moving lower targeting the oversold level. The price is still moving at the 20-period but still above the 50, and 200-period moving averages.
Our daily resistance levels are at $1,992 and $2,013, with the support levels at $1,971 and $1,954.
Conclusion: This week, we will have some US high-impact news such as advance GDP and Core PCE Price Index which may affect the demand for gold. For this week, we expect that gold may move lower in the early of the week before rising higher to reach back the $2,000 level.
EURUSD
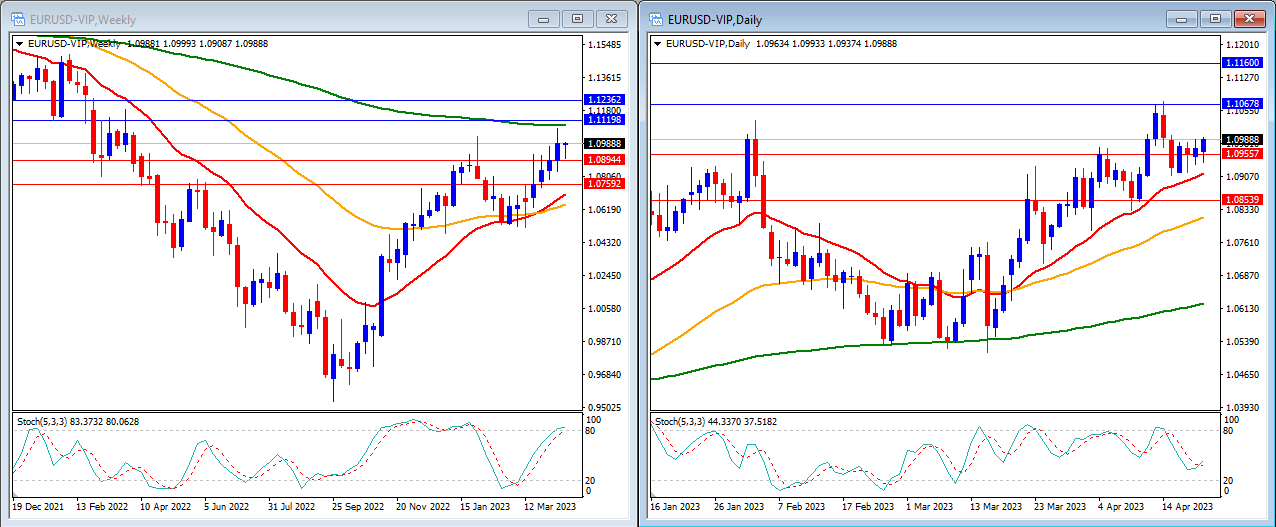
Last week, EURUSD was able to move lower but just to close back higher. EURUSD closed the week at 1.0988.
On the weekly timeframe, the Stochastic Indicator is moving higher entering the overbought level. The price is still trading below the 200-period moving average, but above the 20 and 50-period moving averages.
Our weekly resistance levels are at 1.1119 and 1.1236, with support levels at 1.0894 and 1.0759.
On the daily timeframe, the Stochastic Indicator is moving lower in the middle. The price is now moving above the 20, 50 and 200-period moving averages.
Our daily resistance levels are at 1.1067 and 1.1160, while the support levels are at 1.0955 and 1.0853.
Conclusion: This week, there won’t be any high impact news from the EU zone, which means that the US high impact news will be the market mover for the EURUSD. We expect that EURUSD may move higher and try to reach our resistance level at 1.1067.
DJ30
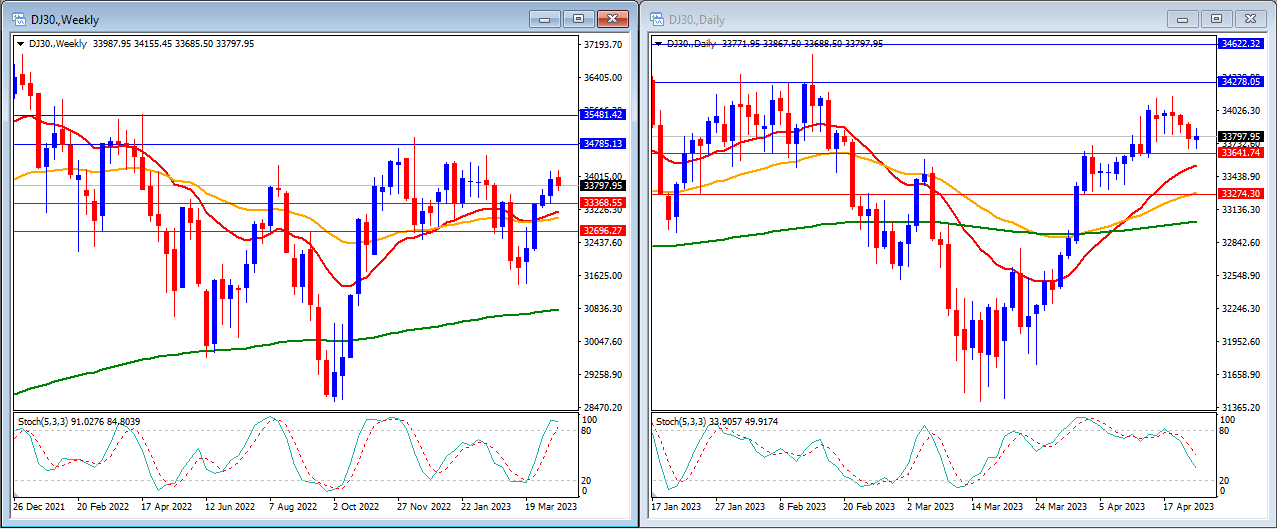
Last week, the DJ30 moved slightly lower as the earning seasons resulted in some surprising results. The DJ30 closed the week higher at 33797.
On the weekly timeframe, we can see that the Stochastic Indicator is entering the overbought level. The price is now moving above the 20, 50 and 200-period moving averages.
Our weekly resistance levels are at 34785 and 35481, with support levels at 33368 and 32696.
In the daily timeframe, we can see that the Stochastic Indicator is moving lower in the middle. The price is now moving above the 20, 50 and 200-period moving averages.
Our daily resistance levels are at 34278 and 34622, with support levels at 33641 and 33274.
Conclusion: We are still in the earning season week, we expect that DJ30 will get boosted and back to move higher and reach our resistance level at 34785.
USOUSD
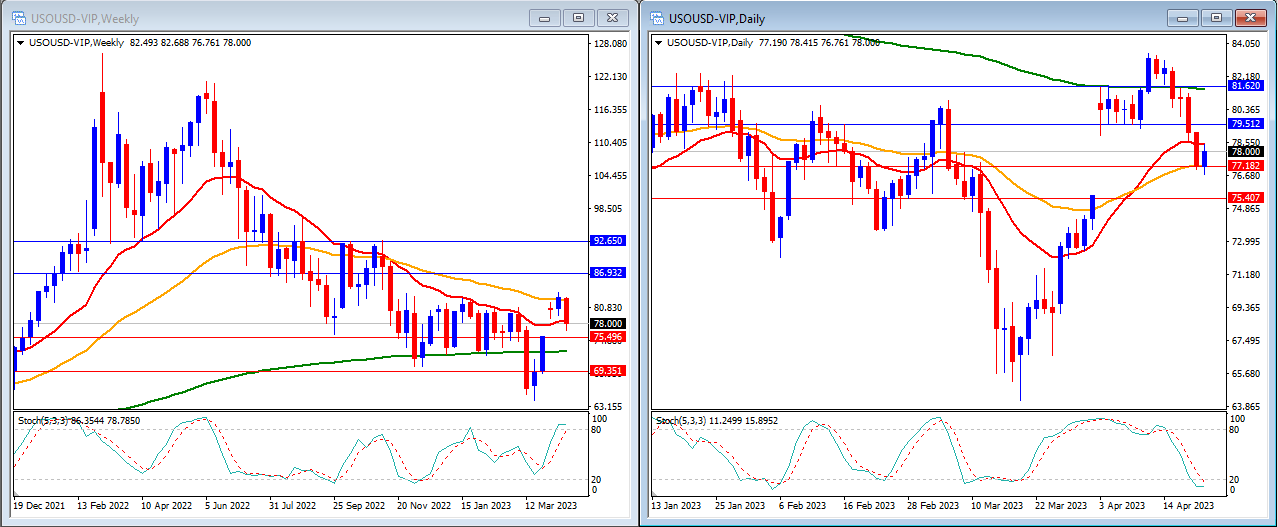
Last week, USOUSD (Oil) was back lower and able to break below the 80-level barrier. USOUSD closes the week at 78.
On the weekly timeframe, the Stochastic Indicator is entering the overbought level. The price is moving just at the 20-period, below the 50-period and above the 200-period moving averages.
Our weekly resistance levels are 86.93 and 92.65, with support levels at 75.49 and 69.35.
On the daily timeframe, the Stochastic Indicator is entering the oversold level. Price is now moving below the 20 and 200, but above the 50-period moving averages.
Our daily resistance levels are at 79.51 and 81.62, while support levels are at 77.18 and 75.40.
Conclusion: Oil uncertainty still weighs in. We may see some slight lower and reach our support level at 77.18.
NAS100
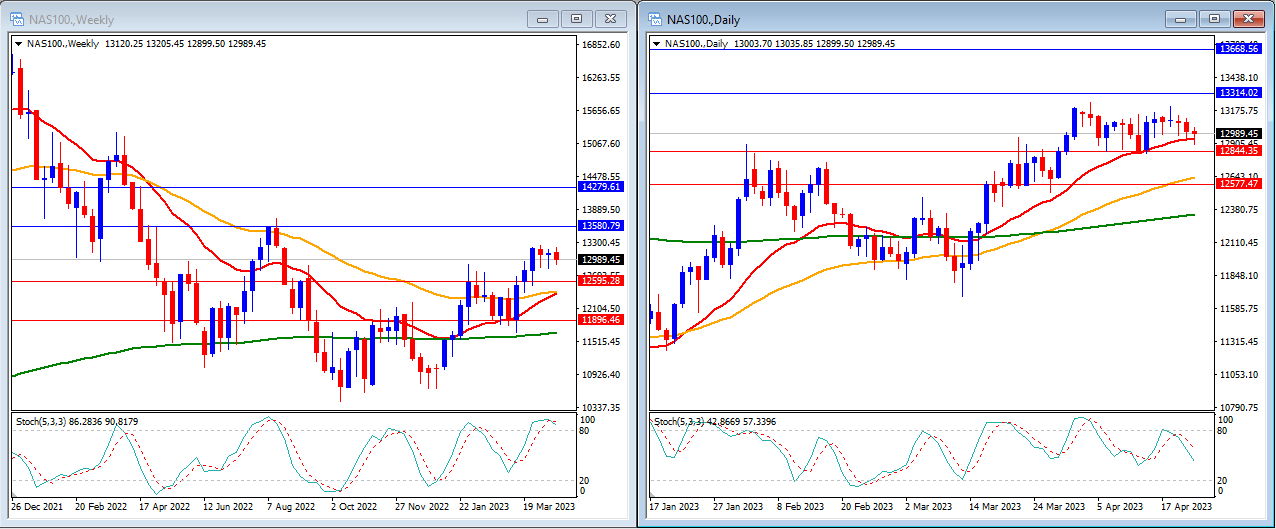
Last week, the NAS100 moved slightly lower after a surprising earning season week. The NAS100 closed the market at 12989.
On the weekly timeframe, the Stochastic Indicator is moving inside the overbought level. The price is currently above the 20, 50 and 200-period moving averages.
Our weekly resistance levels are at 13580 and 14279, with support levels at 12595 and 11896.
On the daily timeframe, the Stochastic Indicator is moving lower in the middle. The price is still trading above the 20, 50, and 200-period moving averages.
Our daily resistance levels are currently at 13314 and 13668, while support levels are at 12844 and 12577.
Conclusion: Since we are still in the earning season week, we expected that NAS100 might get a boost and move back higher to reach our resistance level at 13314.
GBPUSD
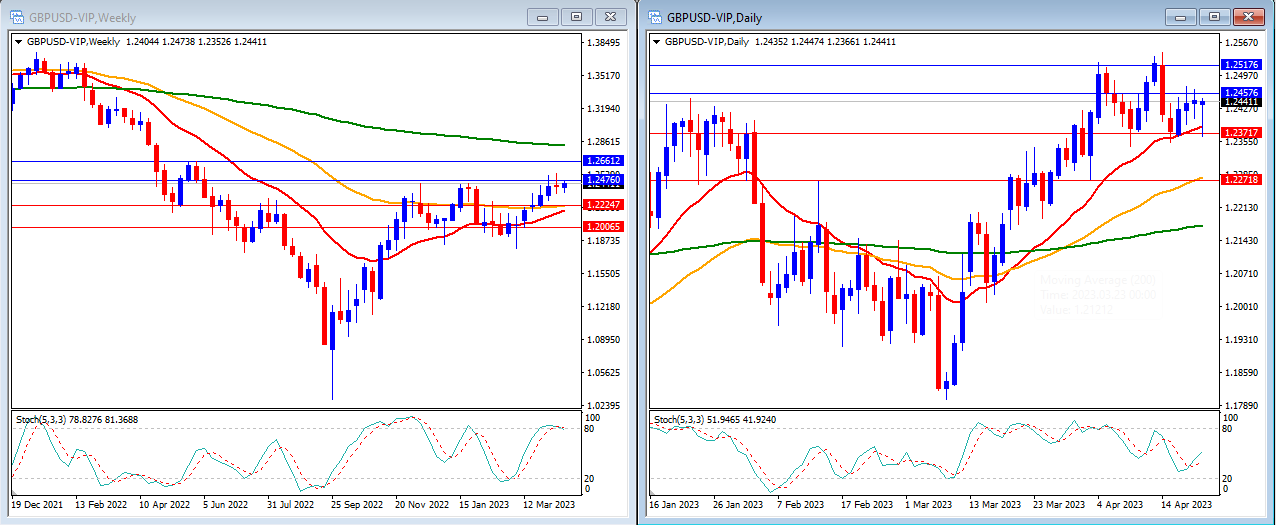
Last week, GBPUSD moves slightly higher but still below our resistance level. GBPUSD close the week at 1.2441.
On the weekly timeframe, the Stochastic Indicator is moving inside the overbought level but there’s an indication that it will exit. The price is moving above the 20 and 50-period moving averages and below the 200-period moving average.
Our weekly resistance levels are at 1.2476 and 1.2661, while support levels are at 1.2224 and 1.2006.
On the daily timeframe, our Stochastic Indicator is moving in the middle. The price is still above the 20, 50, and 200-period moving averages.
Our daily resistance levels are now at 1.2457 and 1.2517, while support levels are at 1.2371 and 1.2271.
Conclusion: We will not have any high-impact news from the UK this week which means that the US economic data will be the market mover. For this week, we expected that GBPUSD will move lower and try to reach our support level at 1.2224.
USD Index
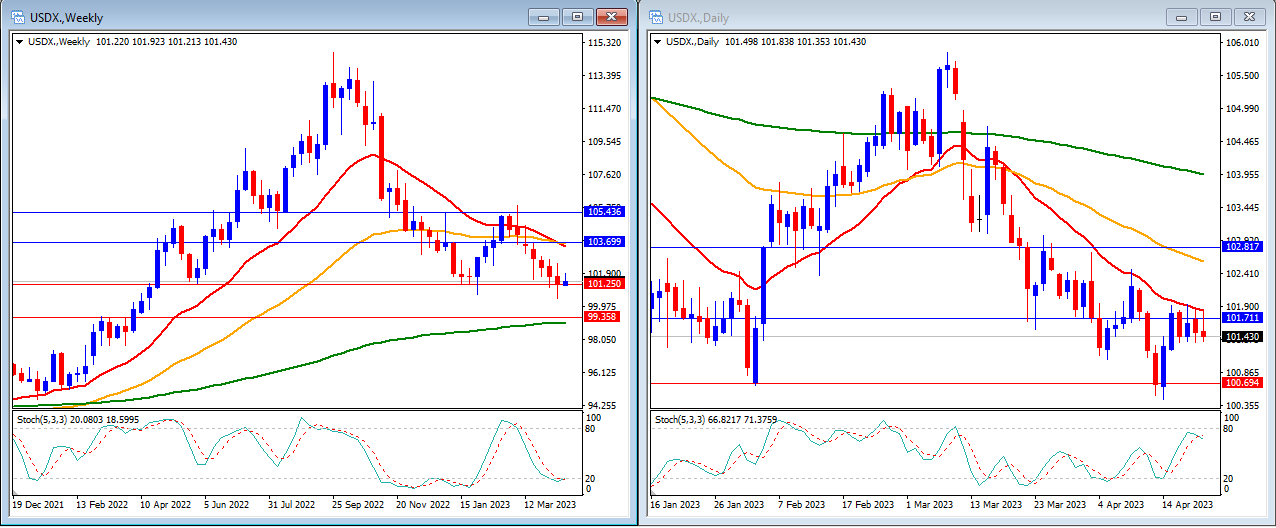
Last week, USD Index was able to move stable as the market is still not as convinced by the condition in the US. The USD Index moved slightly higher and closed the week at 101.43 just above our support level.
On the weekly timeframe, we can see that the Stochastic Indicator is entering the oversold level. Price is moving BELOW the 20 and 50-period moving averages but still above the 200-period moving average.
Our weekly resistance levels are at 103.69 and 105.43 with the support levels at 101.25 and 99.35.
On the daily timeframe, the Stochastic Indicator is moving lower just below the overbought level. Price is now moving below the 20, 50 and 200-period moving averages.
Our daily resistance levels are 101.71 and 102.81 with the support levels at 100.69 and 99.78.
Conclusion: This week we have Advance GDP and Core PCE Price Index for the US, this might be the market mover for this week. We anticipate that the USD Index might slightly move higher and reach above our daily resistance level at 101.71.
USDJPY
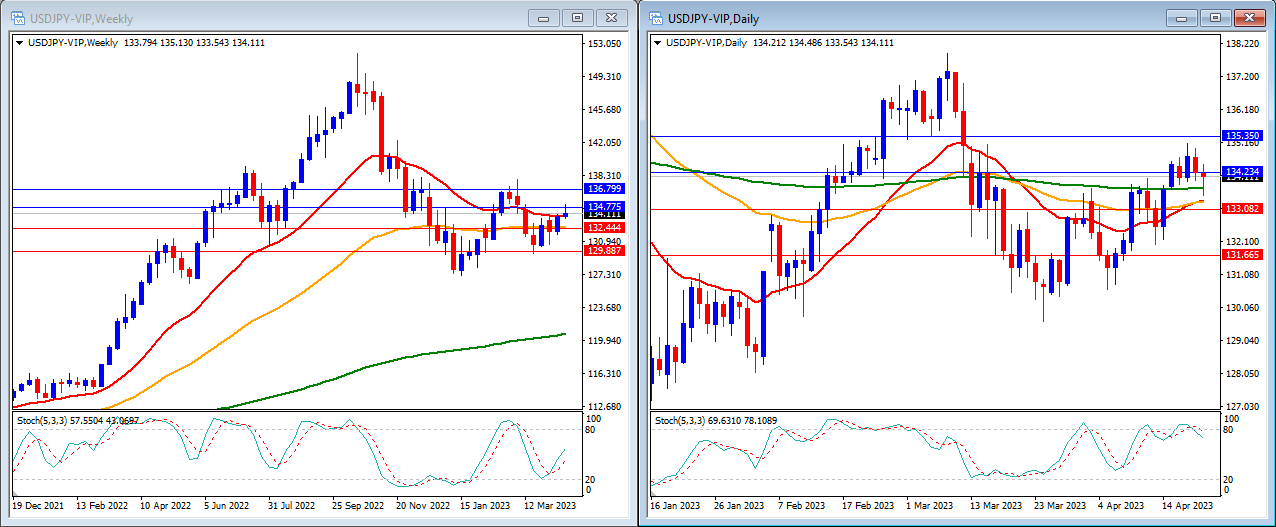
Last week, USDJPY was able to move higher and reach our resistance level at 134.77. USDJPY closes the week at 134.11.
On the weekly timeframe, we can see that the Stochastic Indicator is crossing back higher in the middle. The price is moving around the 20-period, but above the 50 and 200-period moving average.
Our weekly resistance levels are at 134.77 and 136.79, with the support levels at 132.44 and 129.88.
On the daily timeframe, the Stochastic Indicator is moving higher around the overbought level. Price is moving above the 20, 50 and at 200-period moving averages.
Our daily resistance levels are now at 134.23 and 135.35, while the support levels are at 133.08 and 131.66.
Conclusion: This week we are expecting that the sentiment still goes against the JPY. We expected USDJPY to continue to move higher to reach our resistance level at 134.23.


