
Chapter 34 U.S. PCE Indicator will be Released on December 23rd, 2022
XAUUSD: A Huge Increase in Gold Prices is Expected on December 23rd, 2022 Due to the Release of the U.S. Core PCE Data
Summary:
Eyes and Ears on tomorrow’s PCE indicator decision. The Core PCE Price Index was previously 0.2% monthly and is expected to come to the same level of 0.2% monthly on December 23rd, 2022. A higher-than-expected reading is considered bullish for the USD, and a lower-than-expected reading is considered bearish for the USD.
1. Fundamentals
In today’s article, we will discuss the PCE effect on the market. To start with, PCE is the personal consumption expenditure that measures the changes in the price of goods and services purchased by consumers for the purpose of consumption, excluding food & energy. It is one of the personal income reports and outlays, personal income includes income from wages & salaries.
The PCE will be announced on December 23rd, 2022. It is true that CPI and interest rate are the indicators that measure inflation, however; the fed relies also on PCE data, the difference between CPI and PCE is that PCE measures the change in goods and services consumed by all households & non-profit organizations, while the CPI measures the change in all expenditures for all urban households.
On December 1st, the Core PCE came out to be 0.2% down from 0.5% previously and a forecast of 0.3% for the MoM. It was bearish for the USD, and a sharp decline in the Dollar Index was monitored down by 60 cents, for the gold it went up after the indicator by 20$.
In tomorrow’s result, if the Core PCE came higher as expected it will come bullish for the USD, and Dollar Index will further increase. If the results came lower than expected, it will go bearish for the USD, and the dollar index will see a decrease in prices.
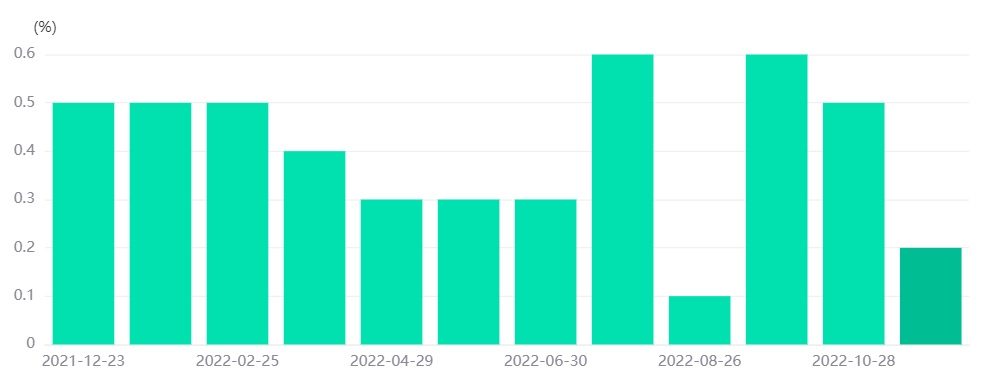
U.S Core PCE MoM Chart
Technical Analysis
Gold Intraday Chart
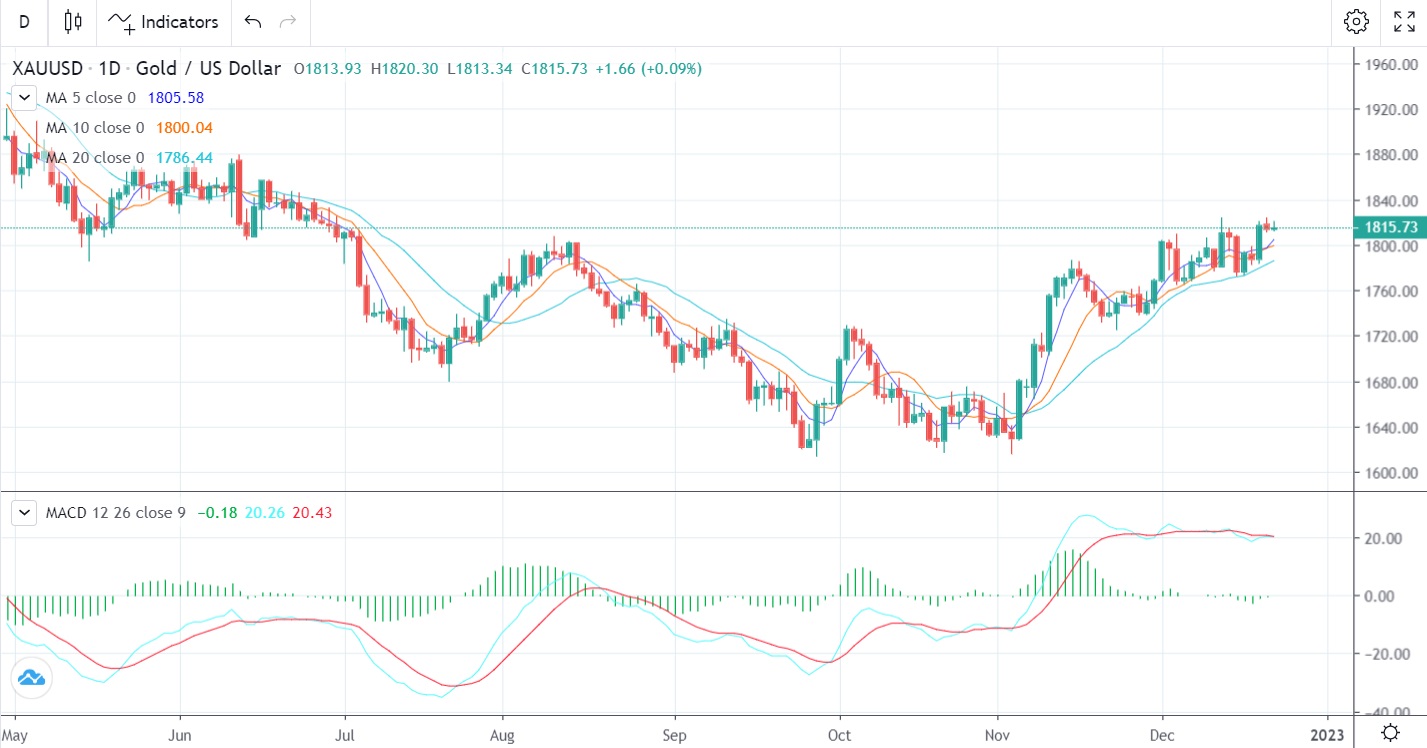
Gold Daily Chart
The Intraday Gold pattern shows a bullish engulfing with possible prices touching the $1830 level later tomorrow.
Support and resistance:
1813.20
1809.60
1805.43
Pivot: 1815.56
1824.2
1821.34
1818.60
2. Trading Recommendations
Trading Direction: Long
Entry Price: 1810.00
Target Price: 1835.00
Stop Loss: 1795.00


