
章节 1 8 Steps to Trading Financial Markets
Contents
The Sign Language – Charts
ow would you communicate with a person who is deaf, dumb and doesn’t know how to read/write? Sign
Language! Isn’t it.
To simply understand markets, we need to start communicating through its sign language, i.e. charts.
Sign language Charts
LinePieBarCandlesticks
There are different types of charts. The most prevalent today is candlesticks, invented by the Japanese. We shall have our focus on Japanese candlesticks for its sheer ability to generate perfect signal timings.
• Basic 2 candlesticks
(%3) Bullish and (ii) Bearish
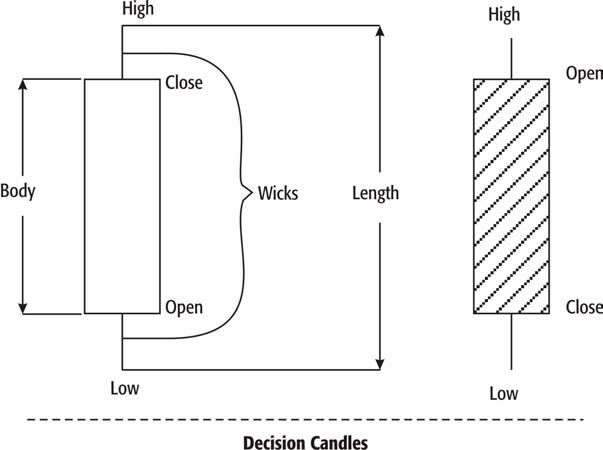
Let’s divide the candle into 3 parts
i)Middle cylindrical potion |
�� |
Body |
ii)Upper/lower wicks |
�� |
Wicks |
iii) High to low |
�� |
Length |
Bullish: When the close is significantly higher than the open it is termed as Bullish Candle. Control is with the bulls.
Bearish: When the close is significantly lower than the open, it is termed as Bearish Candle. Control is with the bears.
These two are basic candle patterns and let’s call them Decision Candles (since control is clearly with bulls or bears)
• Other Candle Types
Indecision Candles
Indecision Candles
I’ve shown a few other candle types above. Each one has got its name, Spinning Top, Hammer, Star, Dragonfly, etc. But knowing names isn’t important here.
If you closely observe all the above ones, a common thing appears. “Neither Bulls or Bears have control!” and this is important to know. There are close to 95 such candle patterns; believe it or not, the only important thing to note is neither party has got control; and let’s call them Indecision Candles.
So we have 2 general types of candles (i) Decision and (ii) Indecision. I hope this simplifies matters.
The next question that comes to our minds is when do we get a trade signal? What do you say – After a decision candle or an indecision candle?
Here is the signal for us:
When we have a specific combination of decision and indecision candles, it’s a trade signal for us. There are only 6 such signals: 3 to buy & 3 to sell. Are we simplifying now? Let us see each signal now. By the end of this discussion,
You shall be having answer to the question WHAT? I.e. What action has to be taken? BUY or SELL. But do not hurry, it is only 25%, before you start trading.
i) If you have a combination of a bearish candle, minimum one indecision candle and a bullish candle, whose body is minimum 60% of the bearish body, then you have a BUY signal which is a Morning star. Please remember, there has to be at least one indecision candle and there can be up to 15 Indecision candles before the bullish candle appears.
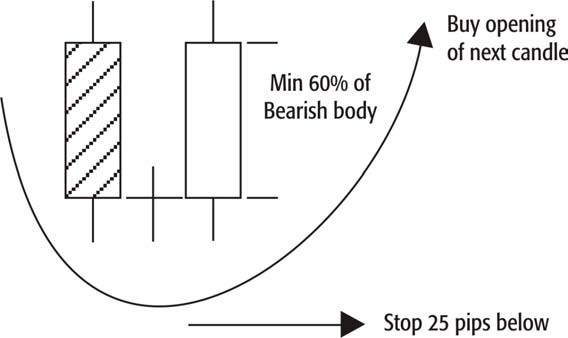
Morning Star
This pattern has to be bought at the opening of next candle and out stop should go around 25 PIPs below the low of the pattern (the lower low.)
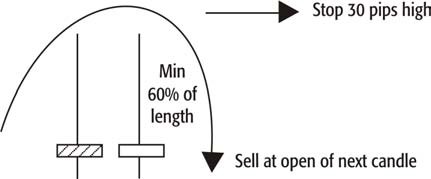
ii) If you have a combination of a bullish candle, minimum one indecision candle and a bearish candle, whose body is minimum 60% of the bullish body, then you have SELL
signal, which is an Evening Star. Please remember, there has to be at least one indecision candle and there can be up to 15 before the bearish candle appears.
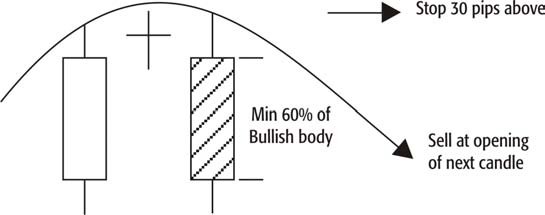
Evening Star
This pattern has to be sold at opening of next candle and our stop should go around. 30 PIPs above the high of the pattern (the highest level).
iii) If you have a combination of at least 2 indecision candles, back-to-back, whose lower wicks are min 60% of length; then it is a BUY signal, Tweezer Bottom. Please remember both candles must appear back-to-back.
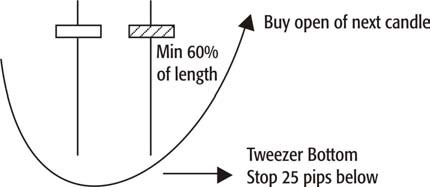
This pattern has to be bought at opening of next candle, the stop should go 25 PIPs below the low of pattern.
iv) If you have a combination of at least 2 indecision candles, back-to-back, whose, upper wicks are min 60% of their respective lengths; then it’s a SELL signal. Tweezer Top. Please remember, both candles must appear back-to- back.
This pattern has to be sold at the opening of next candle, the stop should go 30 Pips above the high of pattern.
v) If you have a combination of a bearish candle, immediately followed by bullish candle, that engulfs the bearish body; then it is a BUY signal, Engulfing Bullish.
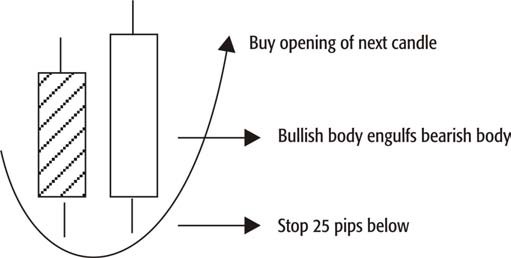
Engulfing Bullish
This pattern has to be bought at opening of next candle, stop should go 25 PIP below low of pattern.
vi) If you have a combination of a bullish candle, immediately followed by a bearish candle, that engulfs the bullish body; then it is a SELL signal; Engulfing Bearish.
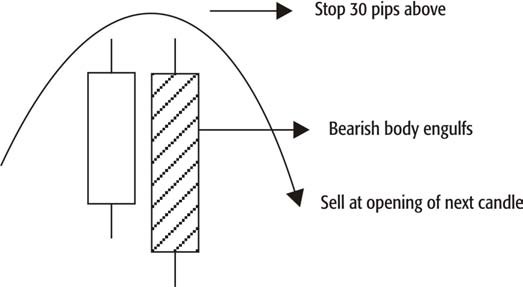
This pattern has to be sold at opening of the next candle, stop should go 30 PIPs above high of the pattern.
We have just answered the question WHAT (action to be taken). Please hold, we still need to cater WHEN, WHY & WHERE before it’s OK to trade with confidence.
You can act on above patterns accordingly, but there are 2 exceptions where it’s not recommended to act.
• During Sideways Movement
• In between Cycles/moves. I.e. if you missed the right place to act on a pattern/signal, patiently wait for the other one; do not rush!
The Game – Supports & Resistances
hat would you do if you want to learn any game? The right method should be knowing the rules first and
then play. Do you agree?
Trading is a game and as any other game, there are rules here as well. Let’s understand the rules first.
1) BullsBears
2) There are programmedThey are programmed to drag to drag prices higher.prices lower.
3) When a new high isWhen a new low is made, made, Bulls score aBears score a point and they point and they take atake a break (pullback) break (pullback) forfor a while
a while.
4) (When bulls break)(When bears break) Past Past resistance, itsupport tends to provide tends to providefuture resistance. future support
Please find below, a graphical representation of the rules:
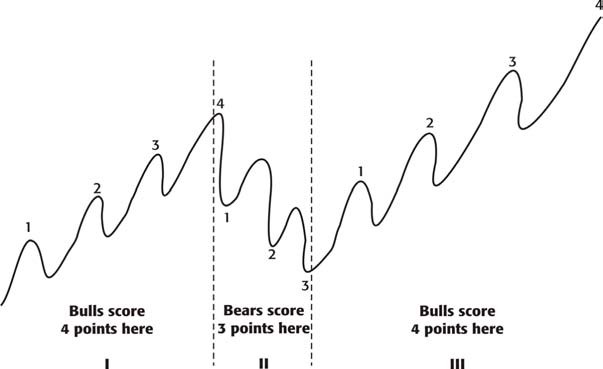
Now, since we are clear with rules of the game, let’s go further. While the bulls and bears are playing this game, two things are formed; supports (when bulls are active) and Resistance (when bears are active). Let’s understand both of them.
• Support
To understand support, let’s first understand what a low is.
Low
Low
Not a low yet
A point, which is lower than the lows of 2 candles to the right and 2 candles to the left, is termed as THE LOW.
Having identified a low, let’s go to find support. Support is a low which is
i) Higher than the previous low and
ii) A new high is in place
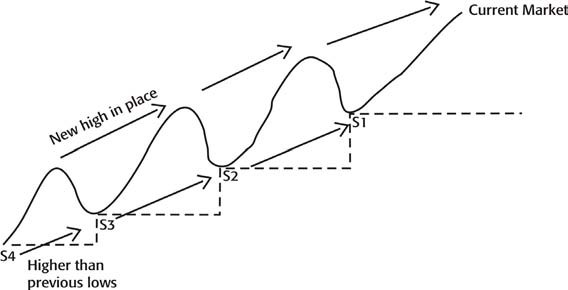
When market is in an uptrend, as shown above, it forms supports and moves ahead (higher). Hence in an uptrend, supports are more significant.
The view should be like an up staircase.
• Resistance
To understand resistance, let’s first understand what a high is.
HighHighNot a high yet
A point which is higher than the highs of 2 candles to the right and 2 candles to the left, is termed as THE HIGH.
Having identified a HIGH, let’s find resistance.
Resistance is a high which is
i) Lower than the previous high and
ii) A new low is in place.
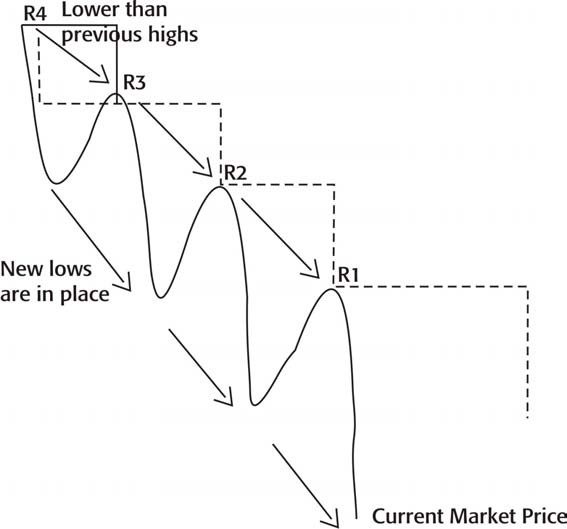
When market is in a downtrend, as shown above, it forms resistance and moves ahead (lower). Hence in a downtrend, resistance are more significant.
The view should be like that of a down staircase.
Let’s now try to merge both the views as shown below:
Current Market Price
• Your visualization of a given chart should be similar to what is shown here.
• Try and have at least 4 levels of supports and resistances before trading.
Please remember:
In an uptrend, past resistance tends to provide future support; while in a downtrend, past support tends to provide future resistance.
How the Game is Played
ow since we are aware of the rules of the game, lets discuss how the game is played, i.e. with help of Trends
& Trend lines.
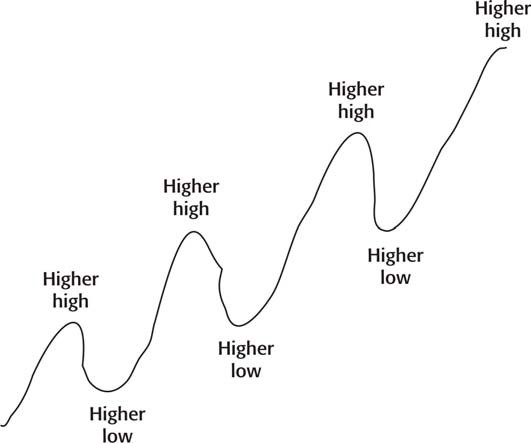
Uptrend
When the market makes higher highs and higher lows it is said to be in an uptrend. Kindly see it below:
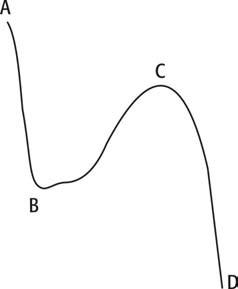
Let’s now look into a typical uptrend cycle:
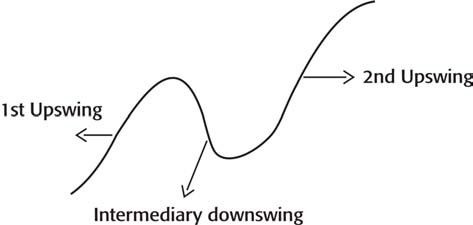
There are typically 3 swings.
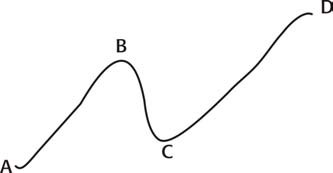
As shown above, first upswing consists of AB boundary. Intermediary downswing brings into formation the BC boundary and second upswing forms the CD boundary.
In an uptrend, ABCDs repeat themselves. Kindly look into a typical trend cycle below:
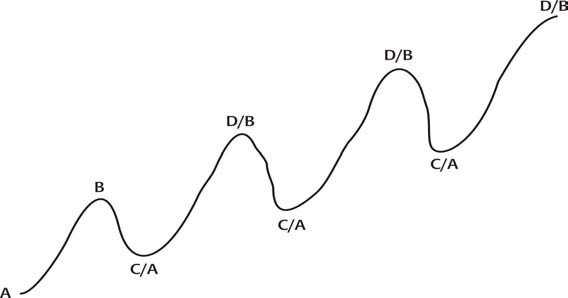
• After one ABCD completes, C becomes A and D becomes B.
• ABCD repeat themselves till uptrend is in place.
Trend Lines
There are typically three types of trend lines
i) Inner Trend Line
This line makes us aware of the immediate market conditions/movements.
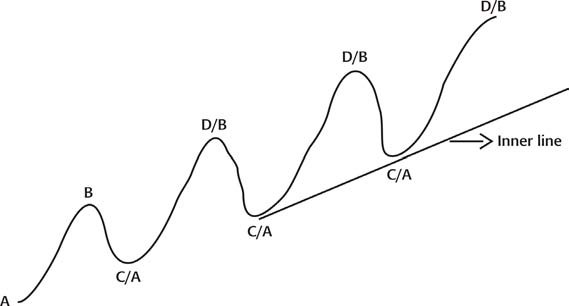
To draw the inner line kindly follow the rules below:
i) Identify the most recent up ABCD
ii) Draw a straight line across the lows of A & C
iii) Such that no candle is cut between point A and Point D (Kindly refer to above figure).
ii) Outer Line
It gives the intermediary market situation/condition.
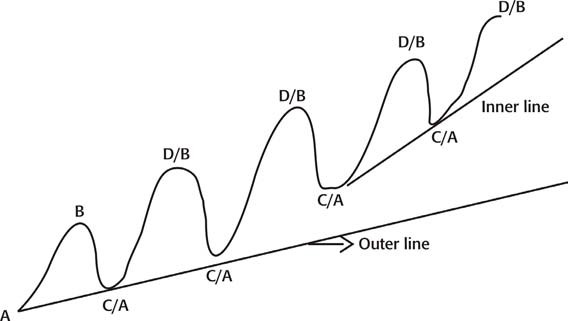
To draw the outer line, kindly follow rules below:
i) Identify the first up ABCD cycle.
ii) Draw a straight line across all possible As & Cs
iii) Such that no candle is cut between the first A & last D.
Kindly refer to above chart for outer line.
iii) Long term line:
It gives the longer term market situation/condition.
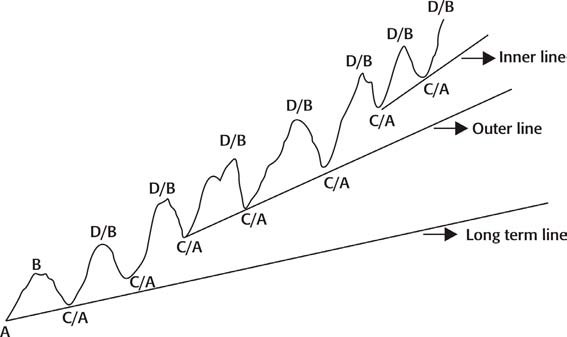
To draw the long term line, kindly follow rules below:
i) Compress the chart, i.e. go back in time.
ii) Follow the same rules as outer line
Kindly refer to the above chart for long term line.
From what we discussed till now, can we come to the following conclusion when there is an uptrend: Buy @ C, Sell @ D.
Rules to trade an uptrend
i) Plot A, B, C, Ds – Supports & Resistances.
ii) Plot trend lines (at least inner & outer)
iii) Find the recent up AB boundary
iv) Spread Fibonacci across AB boundary. This point shall be discussed in the next session.
v) Wait for C to appear at
1. Trend line is passing through, or
2. Past resistance becoming future support, or
3. Fibonacci number line passing through, and
4. Bullish Signal appears (Morning Star, Tweezer Bottom or Engulfing Bullish)
vi) Buy the opening of next candle after looking into equity management (this shall be discussed in the coming sessions), place stop below part A.
Downtrend
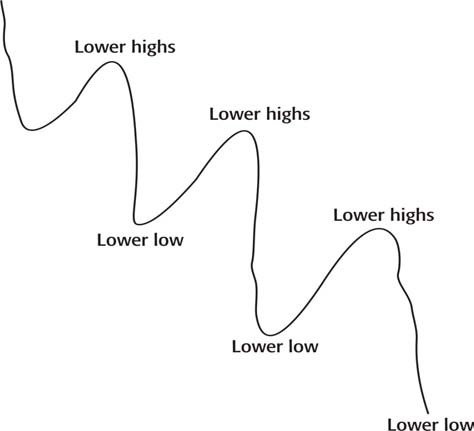
Let’s now look into typical downtrend cycle:
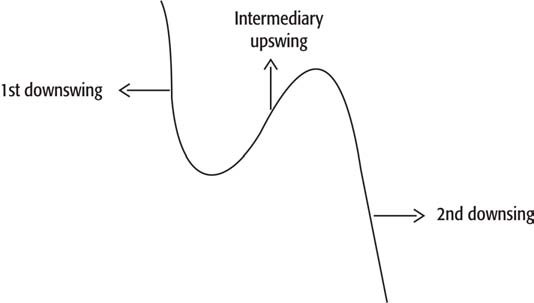
There are typically 3 swings.
As shown above, the 1st downswing consists of AB boundary Intermediary upswing brings into formation the BC boundary and 2nd downswing forms the CD boundary.
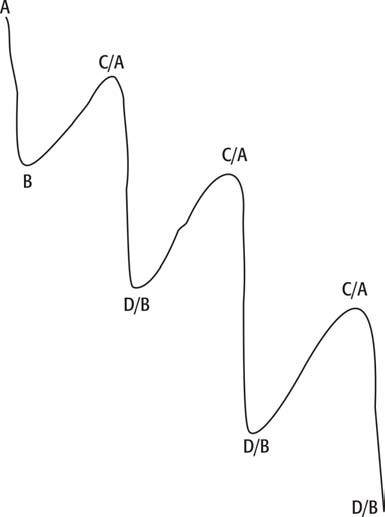
• After one ABCD completes, C becomes A and D becomes B.
• ABCD repeat themselves till downtrend is in place.
Trend lines:
There are typically 3 types of trend lines as were in an uptrend:
i) Inner Trend line
This line make us aware of the immediate market conditions/movements.
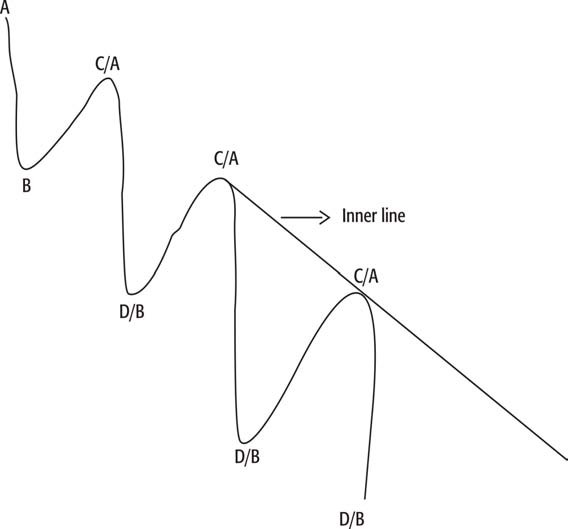
To draw inner line kindly follow the rules below:
i) Identify the recent down ABCD.
ii) Draw a straight line across the highs of A & C.
iii) Such that no candle is cut between A & D. Kindly refer to above figure.
ii) Outer Trend line:
This line makes us aware of the intermediary market conditions/movements.
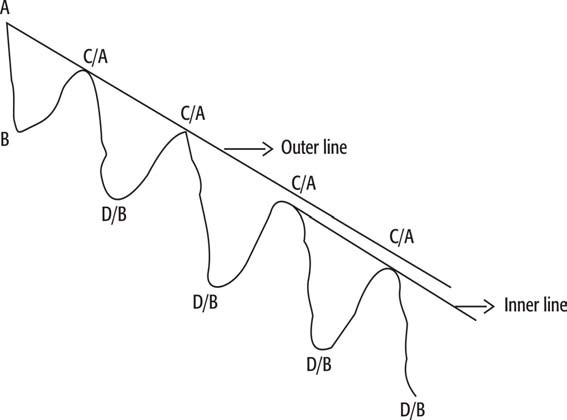
To draw the outer line, kindly follow the rules below:
i) Identify the 1st down ABCD cycle.
ii) Draw a straight line across all possible As & Cs
iii) Such that no candle is cut between 1st A and last D. Kindly refer to above chart for outer line.
iii) Long term Trend line
This line makes us aware of the longer term market conditions/movements.

To draw the long term line, kindly follow the rules below:
i) Compress the chart i.e. go back in time.
ii) Follow the same rules as outer line.
Kindly refer the above chart, for long term line.
From what we discussed till now, can we arrive to the following conclusion,
举报


