فصل 35 January 6th, 2023 NFP Analysis
Dollar Index: The Non-Farm Payroll will be Released on Friday, January 6, 2023, and is Expected to Drop to the 200K Level & Gold Might Show a Huge Increase
Summary:
The dollar index is getting weaker this week falling from the 105 level, and major currencies and metals are increasing significantly. Gold touched the $1824 level, but will it further increase? On Friday, January 6th, 2023, NFP will be released at 5:30 PM (GMT + 4), and the whole market is waiting.
1. Fundamentals
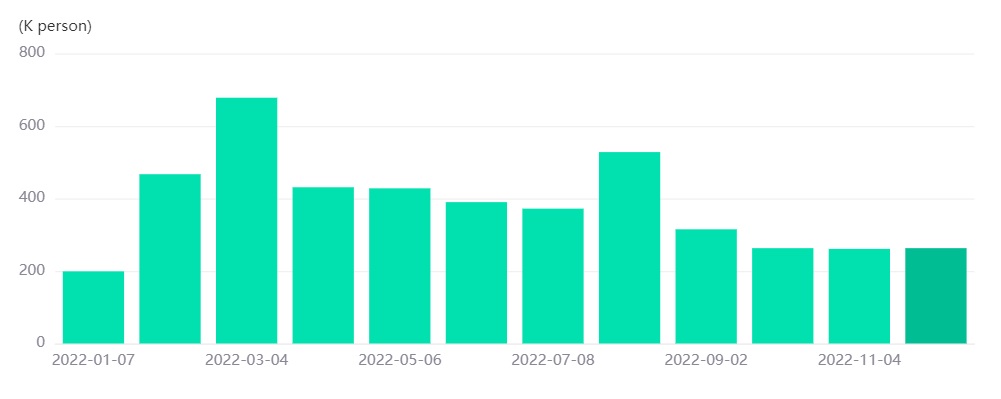
In today’s article, we will discuss the effect of the three different options of the Non-Farm Payroll. To start with, it is important to know that the Non-Farm Payroll is expected to decrease to 200K from a previous result of 263K, but is it the case?
To start with, the Non-Farm Payroll measures the change in the number of people employed during the previous month, excluding the farming industry. Job creation is the foremost indicator of consumer spending, which accounts for the majority of economic activity. It is one of the leading indicators that investors investigate to make decent profits.
What happens if the NFP came at 200K which is expected?
As a rule of thumb, most of the indicators when it is released exactly as the forecast will not have a very big impact on the market, because the market was already impacted by the forecasted result. However, a 250k data would be bearish for the USD, metals and major currencies might increase versus the USD.
What happens if the NFP came below the expected level of 200K?
Below the expected level would result in a bearish trend for the USD, and the dollar will lose momentum versus major currencies and metals such as Gold. A lower-than-expected result would come bearish to the USD.
What happens if the NFP came above the 200k level?
A higher-than-expected result is considered bullish for the USD. If the NFP increased further above 200K, the dollar index will further increase and becomes stronger versus major currencies and metals.
NFP Chart
The FED is looking to further raise the interest rate to a non-forecasted level in 2023. The world’s central banks are looking further to tighten their monetary policy to fight inflation.
2. Technical Analysis
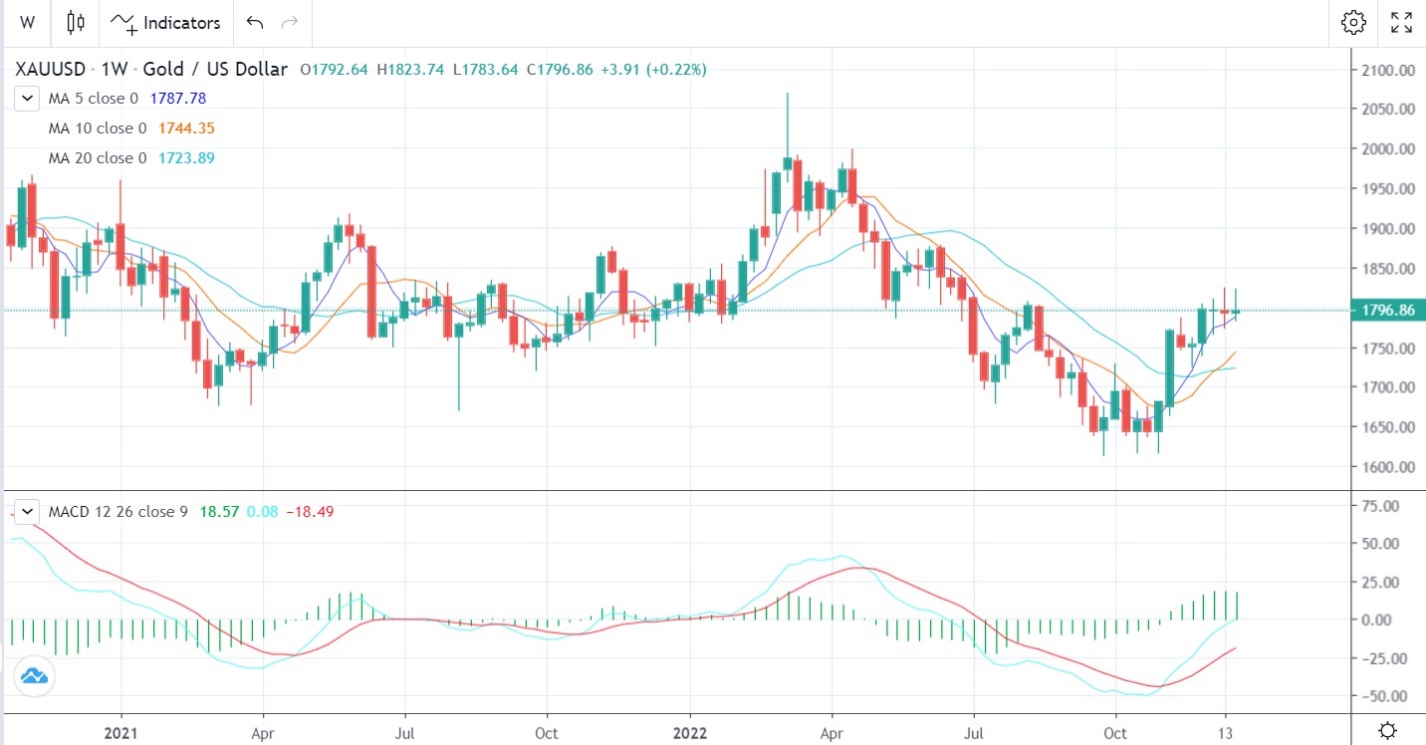
Gold Weekly Chart
Gold Weekly Chart
The Weekly Gold pattern shows a bullish engulfing patter with possible prices touching the $1860 level later in January, 2023.
Support and resistance weekly:
1769.31
1746.27
1718.66
Pivot: 1796.92
1870.60
1847.57
1819.95
3. Trading Recommendations
Trading Direction: Long
Entry Price: 1790
Target Price: 1860.00
Stop Loss: 1750.00


