فصل 24 Analysis of U.S GDP Data
U.S GDP: The U.S Annual GDP Revised QoQ (Q3) Came Unexpected with 2.9% More than Expected at 2.7%
Summary:
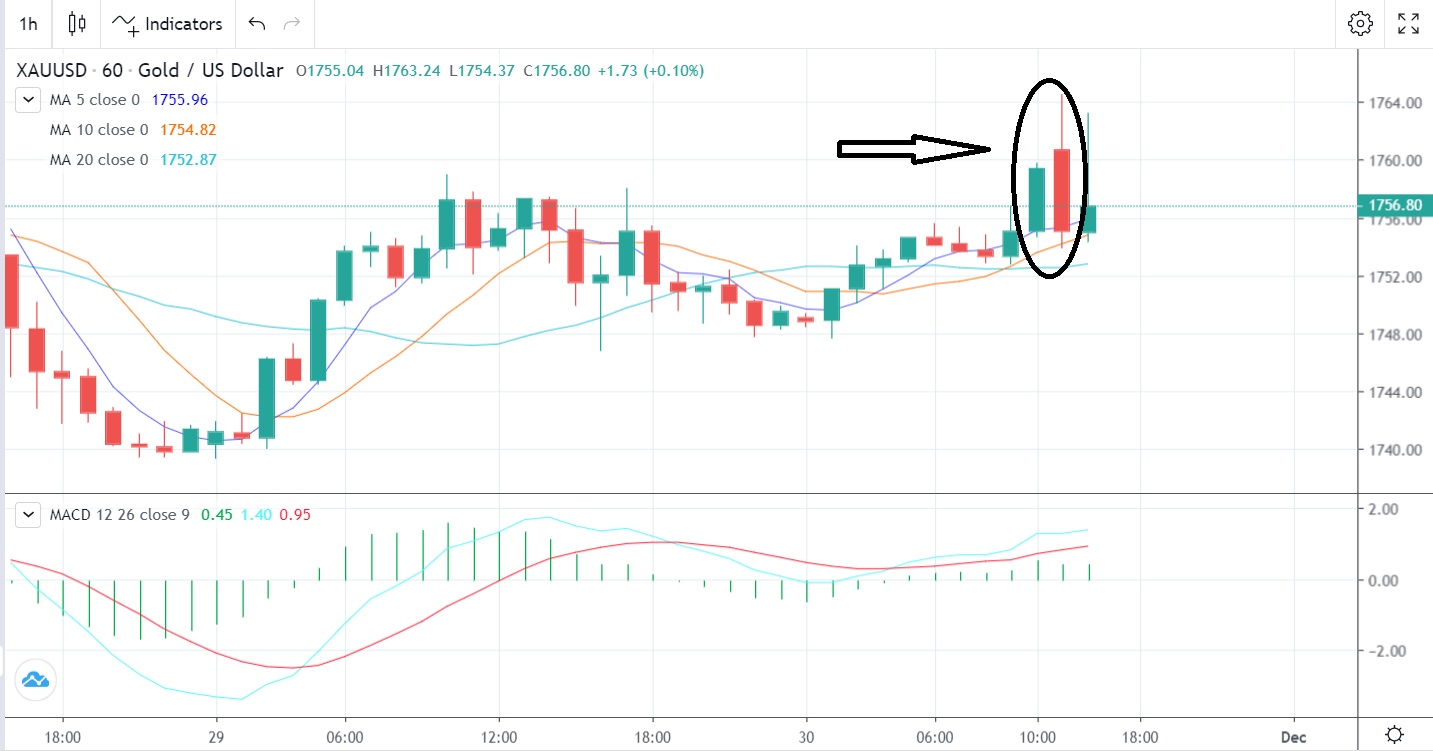
The U.S economy showed some recovery versus major currencies after releasing the GDP data on 30-11-2022 at 3:30 PM (GMT +2) with an unexpected result of 2.9%. Gold went down by $7 from $1763 to $1754.
1. Fundamentals
The U.S released the GDP Revised QoQ report for Q3 on November 30, 2022. The GDP is one of the major indicators that affect the market widely, it measures the annualized change in the inflation-adjusted value of all goods and services produced by the economy and it is the primary indicator of the economy’s health. A higher-than-expected data is bullish for the dollar index, and lower-than-expected data is bearish for the dollar index. The data came out to be 2.9% rather than the forecasted result of 2.7% which was bullish for the dollar. Bears interfered in the market, and gold prices drop sharply by $7 upon this decision.
Gold has decreased sharply from the $1763 to $1754 level breaking the support level, and it is expected to decrease further in the upcoming day due to high volatility in the market because of the Fed meeting in December 13-14 before bouncing up if they agreed to only raise interest rates by 50 BP
Major traders are holding their Gold positions for further price increases.
2. Technical Analysis
Gold Daily Chart
The daily gold pattern shows a bearish engulfing with possible prices touching $1740 level
Support and resistance:
1751.34
1747.48
1740.76
Pivot: 1758.06
1772.50
1768.64
1761.92
3. Trading Recommendations
High Probability Scenario:
Short Below: 1751
Support TP1: 1748
Support TP2: 1746
Alternative Scenario:
Long Above: 1756
Resistance TP1: 1758
Resistance TP2: 1761


